
Why do regions decline? This paper explores how adverse shocks in one period affect regional adjustment to subsequent shocks, emphasizing the role of selective migration. I leverage differential exposure to coal’s decline and variation in proximity to historical employment shifts to study this process of regional decline in Appalachia. The consequences of the 2007–2017 coal shock were more acute in counties that experienced larger declines in college-educated adults due to exogenous labor demand shifts in the 1980s. These findings indicate that the adverse effects of shocks can accumulate over time, leaving certain regions differentially vulnerable to new challenges.
Inequality
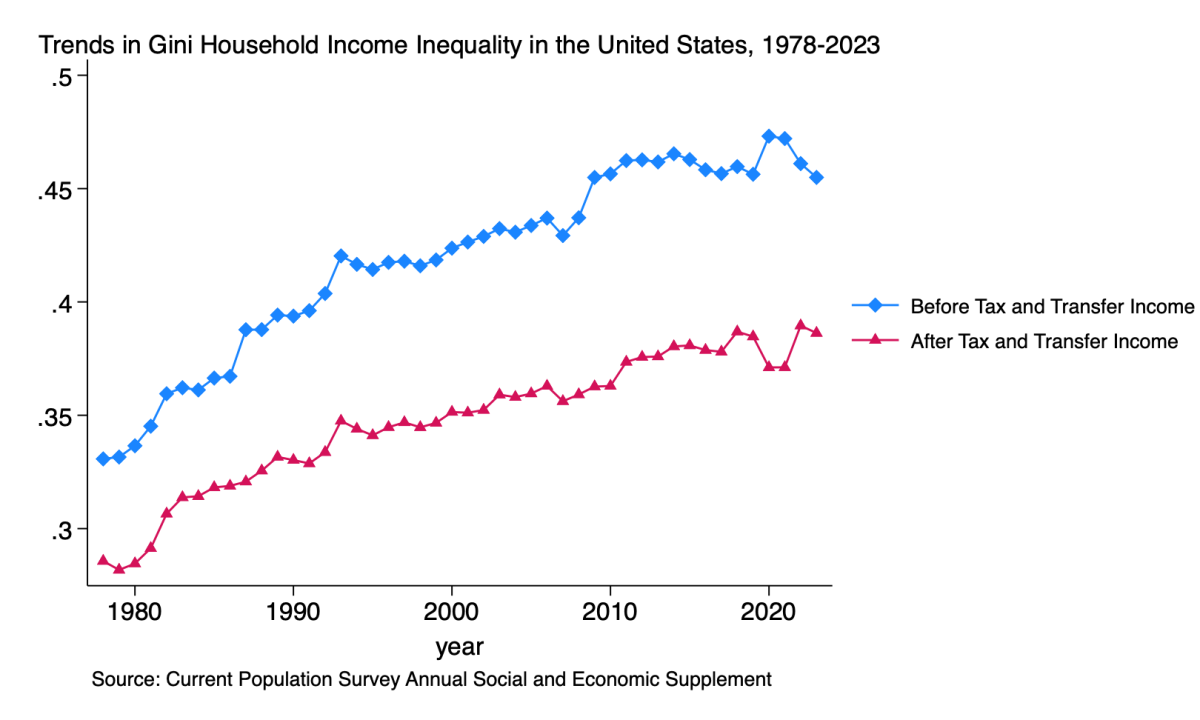 Understanding trends of rising inequality in the United States remains at the fore of both policy and research. As the figure makes clear, redistributive tax and transfer programs attenuate the level of inequality, but not the trend increase over time. Research by UKCPR affiliates Bradley Hardy and Elizabeth Krause, in collaboration with James Ziliak, explore some of the underlying mechanisms behind these developments, including changes in employment, wages, and household composition as part of the Deaton Inequality Country Studies project and published in Fiscal Studies .
2025
Transitional Costs and the Decline of Coal: Worker-Level Evidence
The outside options available to workers critically determine the transitional costs of labor demand shocks. Using comprehensive administrative data, we examine the worker-level effects of the decline of coal — a regionally concentrated labor demand shock that reduced employment by more than 50% between 2011 and 2021. We show that coal workers experienced large and persistent earnings losses compared to similar workers less connected to coal. Unlike worker-level analyses of labor demand shocks in more spatially diffuse industries, we find that non-employment is an important margin of adjustment. Workers receive substantially lower earnings when employed. Moving between sectors or regions does little to mitigate these losses. Instead, we observe significant increases in SSDI receipt. Our findings suggest that transitional costs are higher in regionally concentrated industries when skills do not easily transfer across sectors.
2024
Labor Market Inequality and the Changing Life Cycle Profile of Male and Female Wages
We estimate the distribution of life cycle wages for cohorts of prime-age men and women in the US. A quantile selection model is used to consistently recover the full distribution of wages accounting for systematic differences in employment, permitting us to construct gender and education-specific age-wage profiles, as well as measures of life cycle gender wage gaps. Although common within-group time effects are shown to be a key driver of labor-market inequalities across gender, important additional differences by birth cohort emerge with more recent cohorts of women delaying child rearing, and by implication the onset of child penalties in wages. These important cross-cohort differences help account for the stalling of progress in gender wage gaps over the past quarter century.
Inequality in the United States: 1975-2022
We examine trends in household disposable income inequality and potential mechanisms shaping inequality through changes to work, wages, earnings, marriage, and the tax and transfer system in the United States over the nearly five-decade period from 1975 to 2022. Overall after-tax and transfer income inequality increased more than 25 per cent since the mid-1970s, and by as much as 50 per cent when comparing the 90th and 10th percentiles. While there has been substantial upgrading in formal education credentials among both men and women – an inequality-reducing development – those with fewer credentials have increasingly been less likely to work and marry, each of which could result in higher inequality. The latter effects are exacerbated by those selecting into marriage and cohabitation being more likely to partner with those holding similar educational credentials and earning power. Moreover, the decline in work among the less skilled coincided with the transformation of the safety net to rewarding work. These demographic and policy changes have resulted in a pulling apart of the US income distribution.
Stalled Progress? Five Decades of Black-White and Rural-Urban Income Gaps
We examine the contribution of the U.S. tax and social safety net to ameliorating racial and geographic household income gaps. Using nearly five decades of data from the Current Population Survey Annual Social and Economic Supplement, we make a comparative assessment of after-tax and transfer Black-White and rural-urban household income gaps in relation to similar gaps based solely on household earnings. Our results paint a mixed portrait of economic progress of Black and rural households relative to their White and urban counterparts over the last 50 years. The tax and transfer systems in any given year provide substantial redistribution to low-income Black and rural households, which has resulted in a narrowing of level gaps over time. However, those same level gaps have been exacerbated in the upper tail of the distribution, suggesting the tax code does not undo the underlying economic forces pulling White and urban incomes apart from Black and rural households in the top half of the distribution. This is borne out in the stagnation of rank positional gaps across race and geography.
2021
Income inequality, race, and the EITC
We examine the relationship between the Earned Income Tax Credit (EITC) and Black-White after-tax income inequality from 1980-2020. The EITC lowers overall inequality by 5-10 percent in a typical year, improving the incomes of Black households relative to White households in the bottom half of the distribution. Gains in relative economic status emerged after the 1993 EITC expansion, concentrated among working class Black households, and not extending to those at the very bottom. Estimating the effect of the 1993 expansion on labor supply, we find evidence of a much larger extensive margin employment response for Black households than White households.
Money matters: Consumption volatility across the income distribution
Using data from the Consumer Expenditures Survey, we document the level and volatility of quarterly consumption across the socio-economic distribution. While the measurement of economic well-being in the United States is focused on income, the secular and policy discourse prioritizes income-adequacy to meet family needs. This concern over income adequacy centers on the capacity of individuals and families to predictably consume minimally acceptable levels of basic needs, and the social and economic mobility consequences of low levels of consumption. Our results show a clear socioeconomic and demographic gradient of lower consumption levels amid higher consumption volatility for economically disadvantaged groups. Of particular concern is the stylized fact that, among the categories we track, food and clothing exhibit relatively high levels of consumption volatility among low-income households.
Recent trends in the material well being of the working class in America
I examine trends in the material well-being of working-class households using data from the Current Population Survey in the two decades surrounding the Great Recession. Average earnings, homeownership, and insurance coverage all fell, while absolute poverty and food insecurity accelerated leading up to the Great Recession. After-tax incomes were stagnant for much of the distribution across and within skill groups. On the contrary, the economic hemorrhaging either abated or reversed in the decade after the Great Recession, especially for the least skilled and for households headed by a Hispanic person. This includes robust earnings growth resulting in falling lower-tail earnings inequality, absolute poverty, and food insecurity, coupled with increased insurance coverage and a modest rebound in after-tax incomes. As many of these recent advances likely stalled with the onset of the Covid-19 Pandemic, I discuss various policy options.
2020
Reconciling trends in U.S. male earnings volatility: Results from a four dataset project
There is a large literature on earnings and income volatility in labor economics, household finance, and macroeconomics. One strand of that literature has studied whether individual earnings volatility has risen or fallen in the U.S. over the last several decades. There are strong disagreements in the empirical literature on this important question, with some studies showing upward trends, some downward trends, and some flat trends. Some studies have suggested that the differences are the result of using flawed survey data instead of more accurate administrative data. This paper provides an overview of a project attempting to reconcile these findings with four different data sets and six different data series--three survey and three administrative data series, including two which match survey respondent data to their administrative data. Using common specifications, measures of volatility, and other treatments of the data, the papers show almost uniformly a lack of any significant long-term trend in male earnings volatility over the last 30 years. Moreover, the survey and the administrative data almost entirely agree on that long-term stability when the comparison is done properly. Several possible explanations for the differing finds in past work are suggested by the papers. The stability of earnings volatility raises many questions for future research on trends in the U.S. labor market.
Impact of health reform on health insurance status among persons who use opioids in eastern Kentucky: A prospective cohort analysis
Health insurance improves health and reduces mortality. Expanding insurance is a central feature of the Affordable Care Act (ACA). Persons who use drugs (PWUDs) have historically been at high risk of being uninsured. It is unknown if Appalachian PWUDs, who live in an extremely economically distressed region, are more likely to be insured since implementation of the ACA. Data from a cohort of 503 PWUDs from eastern Appalachian Kentucky, who were interviewed at seven time-points between 2008 and 2017, were analysed using mixed effects regression models. At baseline, only 33.8% of participants were insured, which increased to 87.3% of the cohort at the last follow-up interview. The final multivariate model, which included baseline characteristics and interactions by time, indicated there were significant baseline differences in insurance status by gender, age, education, income, and history of injection. Differences in the predictive margin probabilities of being insured across these groups had dissipated by the final follow-up interview. After Kentucky’s implementation of the ACA, this cohort of Appalachian PWUDs made substantial gains in obtaining insurance that far exceeded the increases reported in national studies.