
Earnings nonresponse in household surveys is widespread, yet there is limited evidence on whether and how nonresponse bias affects measured earnings. This paper examines the patterns and consequences of nonresponse using internal Current Population Survey individual records linked to administrative Social Security Administrative data on earnings for calendar years 2005-2010. Our findings confirm the conjecture by Lillard, Smith, and Welch (1986) that nonresponse across the earnings distribution is U-shaped. Left-tail “strugglers” and right-tail “stars” are least likely to report earnings. Household surveys understate earnings dispersion, reporting too few low and too few extremely high earners. Throughout much of the earnings distribution nonresponse is ignorable, but there exists trouble in the tails.
Inequality
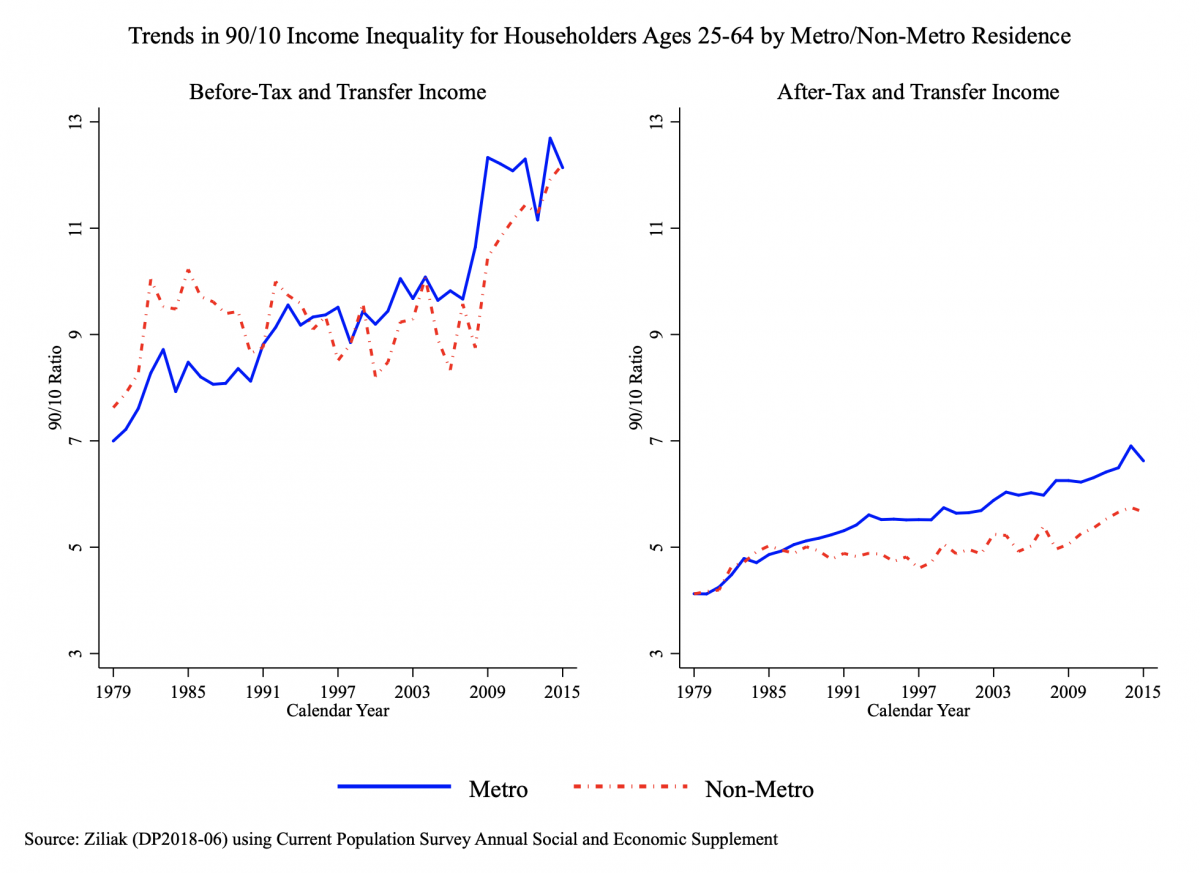 Understanding trends of rising inequality in the United States remains at the fore of both policy and research. As the figure makes clear, redistributive tax and transfer programs attenuate the level of inequality for families living in both urban and rural areas, but as recent evidence in Ziliak (DP2018-06) demonstrates, the U.S. social safety net and tax system levels out inequality more for households in rural communities than urban.
2015
2014
Reassessing the effects of unemployment insurance generosity on search intensity: New evidence from earnings histories
This paper provides the first nationally representative estimates of how unemployment insurance (UI) generosity in the United States affects the search intensity of unemployed individuals using individual level variation in UI generosity. The paper expands the current literature through fully simulating monetary eligibility and entitlement to unemployment insurance at the individual level where past studies have been unable to examine monetary eligibility and have relied on state variations in the maximum weekly benefit amount which can differ significantly from an individual’s actual benefit amount. To simulate monetary eligibility and entitlement, work histories of unemployed respondents were obtained through fully matching American Time Use Survey respondents to all of their observations in the Current Population Survey, the population from which they are drawn. The results suggest that higher replacement rates are associated with large reductions in time spent searching for a job during normal economic conditions. However, the results are more mitigated during the Great Recession and post recession period with higher replacement rates being associated with small and statistically insignificant effects on time spent searching for a job, although these results appear to be partially driven by the years 2009 and 2010 which were at the height of the labor market decline.
2012
Is earnings non-response ignorable?
Earnings nonresponse in the Current Population Survey is roughly 30% in the monthly surveys and 20% in the March survey. If nonresponse is ignorable, unbiased estimates can be achieved by omitting nonrespondents. Little is known about whether CPS nonresponse is ignorable. Using sample frame measures to identify selection, we find clear-cut evidence among men but limited evidence among women for negative selection into response. Wage equation slope coefficients are affected little by selection but because of intercept shifts, wages for men and to a lesser extent women are understated, as are gender gaps. Selection is least severe among household heads.
Decomposing trends in income volatility: The 'wild ride' at the top and bottom
We provide a detailed accounting of the trend increase in family income volatility in recent decades by quantifying the contributions of household head earnings, spouse earnings, non-transfer non-labor income, transfer income, and tax payments (inclusive of the refundable Earned Income Tax Credit), along with covariances among the income components. Using twoyear matched panels in the Current Population Survey from 1980 to 2009, we find that the volatility of family income, as measured by the variance of the arc percent change, doubled over the past three decades. The increase in volatility was most pronounced among the top 1% of the income distribution; however, in any given year the level of volatility among the bottom 10% exceeds that of the top. The variance decompositions indicate that increased family income volatility comes directly from the higher volatility of head and spouse earnings, and other non-labor income, as well as from substantially reduced covariance between these three income sources with the tax system. This suggests that the current tax code is less effective in mitigating income shocks than in previous decades. Among lower income households, a larger share of volatility is driven by transfer income. In the absence of the increased negative covariance between the volatility of head earnings with non-transfer other income, overall volatility would be much higher.
Childhood Income Volatility and Adult Outcomes
Using data linked across generations in the Panel Study of Income Dynamics, I estimate the relationship between exposure to volatile income during childhood and a set of socioeconomic outcomes in adulthood. The empirical framework is an augmented intergenerational income mobility model that includes controls for income volatility. I measure income volatility at the family level in two ways. First, instability as measured by squared deviations around a family-specific mean, and then as percent changes of 25 percent or more. Volatility enters the model both separately and interacted with income level. I find that family income instability during childhood has a small, positive association with high school dropout–one which appears driven by volatility among children from lower income households. Evidence suggests that volatility exposure generally has a minimal impact on intergenerational outcomes relative to permanent income.
2011
Earnings volatility in America: Evidence from matched CPS
We offer new evidence on earnings volatility of men and women in the United States over the past four decades by using matched data from the March Current Population Survey. We construct a measure of total volatility that encompasses both permanent and transitory instability, and that admits employment transitions and losses from self employment. We also present a detailed decomposition of earnings volatility to account for changing shares in employment probabilities, conditional variances of continuous workers, and conditional mean variances from labor-force entry and exit. Our results show that earnings volatility among men increased by 15 percent from the early 1970s to mid 1980s, while women’s volatility fell, and each stabilized thereafter. However, this pooled series masks important heterogeneity in volatility levels and trends across education groups and marital status. We find that men’s earnings volatility is increasingly accounted for by employment transitions, especially exits, while the share of women’s volatility accounted for by continuous workers rose, each of which highlights the importance of allowing for periods of non-work in volatility studies.
If you don't build it: Mexican mobility following the U.S. housing bust
This paper demonstrates the importance of earnings-sensitive migration in response to local variation in labor demand. We use geographic variation in the depth of the housing bust to examine its effects on the migration of natives and Mexican-born individuals in the U.S. We find a strong effect of the housing bust on the location choices of Mexicans, with movement of Mexican population away from U.S. states facing the largest declines in construction and movement toward U.S. states facing smaller declines. This effect operated primarily through interstate migration of Mexicans previously residing in the U.S. and, to a lesser extent, through slower immigration rates from Mexico in states with larger housing declines. There is no evidence that return migration to Mexico played an important role in immigrants' migration response. We also find no impact of the housing bust on natives' location choices. We interpret these results as the causal impact of the housing bust on migration after confirming that they are robust to controls for immigrant diffusion and a pre-housing-bust false experiment.
2010
An exploratory analysis of the relationship between student earnings and postsecondary retention
Policy makers are becoming increasingly concerned about the high percentage of students who attend postsecondary education without completing a degree. Researchers have studied numerous potential determinants of retention behavior for postsecondary students, such as financial aid, socioeconomic status, academic preparedness, academic and social integration, and expected future wages. However, none of these studies considers students’ earnings while in school as a potential determinant of retention. Using an administrative data from postsecondary institutions matched with administrative earnings data from the state’s unemployment insurance department, our results indicate that student earnings are negatively correlated to student retention in Kentucky postsecondary institutions. Our preferred model, hazard, indicates that a percentage increase in earnings reduces time to stopout with a probability of 1.767%. Even after controlling for student intentions, students are more likely to stopout at the rate of 1.050%. Ability as measured by first-term GPA in KCTCS and credits earned in the first semester positively affects retention.
State unemployment protection statutes for victims of domestic violence as an employment matter
Evidence indicates that domestic violence has negative consequences on victims’ employment; yet employers lag in recognizing this as a workplace issue. To address the problem, some states have established several policy solutions. To understand the scope of the public sector’s response to domestic violence as a workplace issue, a content analysis of state-level employment protection policies for domestic violence victims (N=369) was conducted. Results indicate three broad policy categories: 1) policies that offer work leave for victims; 2) policies that aim to reduce employment discrimination of domestic violence victims; and 3) policies that aim to increase awareness and safety in the workplace. Sub-categories emerged within each of these three categories. Implementation of employment protection policies varies significantly across states. Implications for workplaces, practitioners and policy leaders are discussed.
Imprisonment and (inequality in) population health
This article extends research on the consequences of mass imprisonment and the factors shaping population health and health inequities by considering the effects of the imprisonment rate on population health and black-white inequality in population health using state-level panel data from the United States (1980-2004). My results imply that increases in the imprisonment rate harm population health, though the effects on the infant mortality rate and female life expectancy are more consistent than are the effects on male life expectancy. My results also imply that these health effects are concentrated among blacks, implicating mass imprisonment in the persistence of black-white inequities in population health. The effects, moreover, are substantial. According to my estimates, if the American imprisonment rate had remained at its 1980 level, black life expectancy at birth would have been 0.8 years longer in 2004, and black-white inequality in the infant mortality rate would have been 23 percent smaller. My results also indicate, however, that increases in the imprisonment rate are associated with decreases in the mortality rates of young black men. Although imprisonment’s long-term effects on health and health inequities are mostly negative, imprisonment may, in the short-run, have some health benefits for young black men.