
Using data from the 2000 Census, this study examines the relationship between household living arrangements and economic resources among Mexican immigrant families with children. I model separately the relationships between family income and household structure and proportion of total household income contributed and household structure. The results show that families that coreside with extended kin and non-kin have higher incomes, all else equal, relative to those that reside in single-family households. In addition, Mexican immigrant families that reside in extendedhousehold living arrangements contribute about three quarters of total household income. While families may gain some economic efficiency through extended household living arrangements, the results are consistent with expectations that Mexican immigrant families expend scarce resources in support of the migration and settlement of extended kin. The Mexican delayed assimilation thesis suggests such support inadvertently diverts resources away from immigrant children and slows intergenerational progress.
Inequality
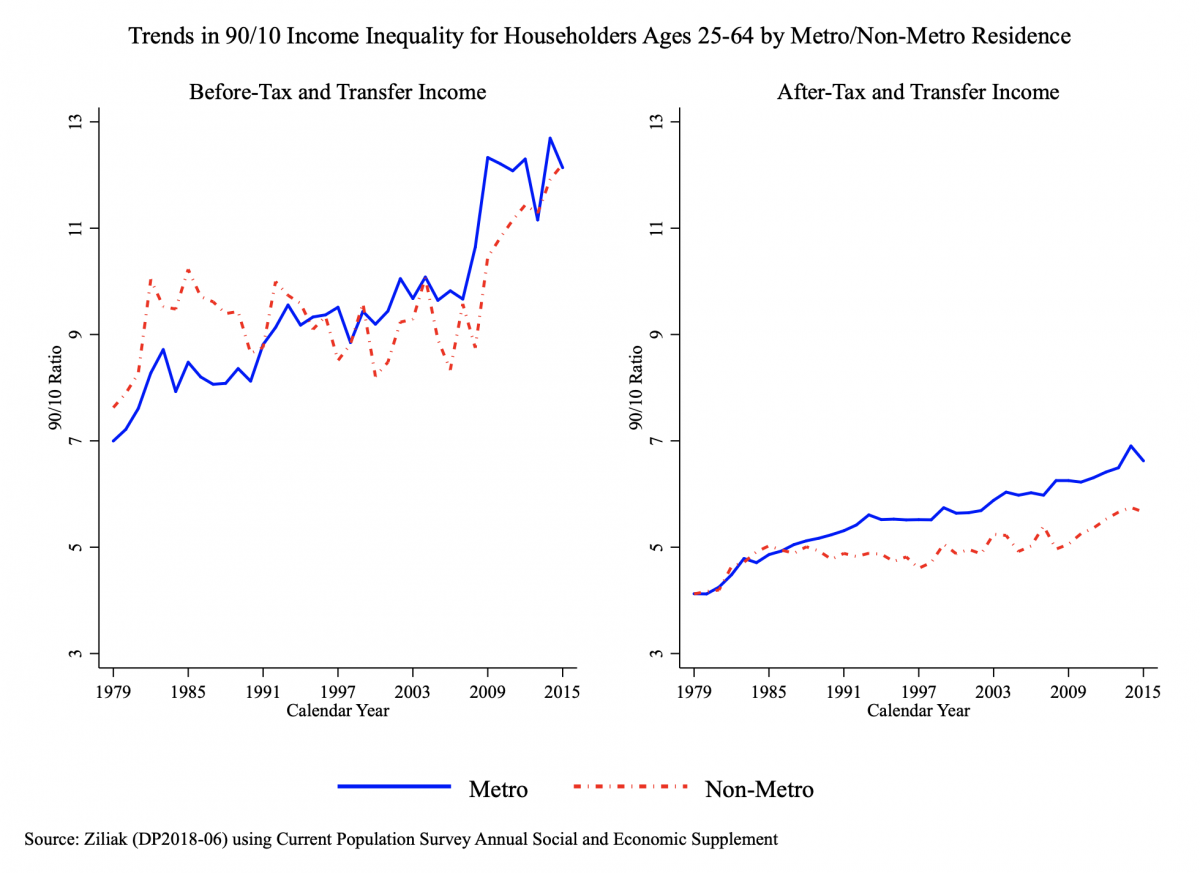 Understanding trends of rising inequality in the United States remains at the fore of both policy and research. As the figure makes clear, redistributive tax and transfer programs attenuate the level of inequality for families living in both urban and rural areas, but as recent evidence in Ziliak (DP2018-06) demonstrates, the U.S. social safety net and tax system levels out inequality more for households in rural communities than urban.
2010
Does race-based redistricting matter for policy?
During the 1990 congressional redistricting many states were mandated to create additional majority minority-resident districts in order to elect more minorities to Congress. Civil rights groups and Republicans cheered. The Party views Democratic districts stripped of Black voters as opportunities to repaint blue districts red. The academic literature agrees, attributing the Republican return to House control in 1994 to race based redistricting. However, this literature generally focuses on the district as the unit of analysis, a focus that is too narrow, as some districts gain Black residents while others lose them. I focus on states, the level at which redistricting occurs. By comparing congressional delegations of states under greater pressure to create majority minority districts with those under less pressure in a difference-in-difference framework, I find no evidence that the creation of majority minority districts leads to more conservative House delegations. In fact point estimates indicate that states that increased their share of majority Black districts saw their delegations grow increasingly liberal. I find similar results for Latino districts in the southwest. Thus I find no evidence of the alleged tradeoff between having minority representatives and representatives who support minorities’ preferred policies.
Poverty, inequality, and cost of living differences
Because of their different geographical distribution, US households are exposed to different levels and trends in cost of living. One contribution of this paper is to document that, as a consequence, the conditional difference between the wage of skilled workers and of unskilled workers is significantly lower in real terms than in nominal terms and has grown less. In 2000, the level of the college premium is 60% in nominal terms and only 51% in real terms. More importantly, the increase in the college premium between 1980 and 2000 in real terms is significantly smaller than the increase in nominal terms. Specifically, at least 22% of the documented increase in the college premium between 1980 and 2000 is accounted for by differences in the cost of living.
The labor market returns to community college degrees, diplomas, and certificates
This paper provides the first detailed empirical evidence of the labor-market returns to community college diplomas and certificates. Using detailed administrative data from Kentucky, we estimate panel-data models that control for differences among students in pre-college earnings and educational aspirations. Associate’s degrees and diplomas have quarterly earnings returns of nearly $2,000 for women, compared to returns of approximately $1,500 for men. Certificates have small positive returns for men and women in most specifications. There is substantial heterogeneity in returns across fields of study. Degrees, diplomas, and certificates all correspond with higher levels of employment.
2009
Inequality and human capital in Appalachia: 1960-2000
This paper examines changes in the earnings distribution of men age 25-64 between 1960 and 2000 in Appalachia and in the remainder of the U.S. Because Appalachia is more rural than the remainder of the U.S. we also examine changes in the earnings distribution in rural vs. urban areas. Our central finding is that there have been large differences in the evolution of the earnings distribution in rural vs. urban areas and this is the principal reason that Appalachia’s earnings distribution differs to some degree from the remainder of the U.S. We find that the bottom of the earnings distribution increased in rural counties between 1960 and 1980 while there was a small decrease in the bottom of the earnings distribution in urban areas. Between 1980 and 2000, urban areas exhibited far more bifurcation of earnings than rural areas. The level and the return to education may play an important role in understanding these patterns. At the bottom of the distribution there was a large increase in education in rural areas relative to urban areas between 1980 and 2000. The relative rise at the top of the earnings distribution in cities is likely caused by men in the upper part of the earnings distribution being much more likely to have a college degree combined with a rapid rise in the return to college education.
Objective and subjective residential context and urban children's weight status and physical and sedentary activities
Despite trends indicating a recent stabilizing in the upward obesity trend for children and adolescents in the U.S., child overweight remains a significant public health issue. Our analysis finds a nonlinear effect – the poorest and wealthiest children in our sample have the lowest BMIs, while the children in the middle of the SES distribution have the highest. Our findings may reflect the fact that younger children are more likely to be physically active than older children and adolescents, and suggest that the relationship between socioeconomic status and physical activity (and overweight) may change during childhood.
Race disparities in birth outcomes in the U.S. South and the rest of the nation
There are well-documented and as yet unexplained disparities in birth outcomes by race in the United States, even after controlling for socioeconomic status. This paper examines the sources of disparities in low birth weight between blacks and whites in the U.S., by focusing on differences in disparities between two very distinct geographic areas, the Deep South and the rest of the country. Two findings from prior research drive the analyses: First, health overall is worse in the Deep South states; Second, race disparities are smaller in the Deep South than in the rest of the nation. A number of potential explanations for these findings are examined. Results suggest that, first, almost all of the increased burden of low birth weight in the Deep South states may be explained by differences in race composition and socioeconomic status between the Deep South and rest of the nation. Second, the lower race disparities found between the two regions are being driven by much worse outcomes for white mothers in the Deep South (vs. the rest of the country), particularly for poor whites, as opposed to better outcomes for black mothers. Potential paths for future research are recommended.
Externalities in the classroom: How children exposed to domestic violence affect everyone's kids
There is widespread perception that externalities from troubled children are significant, though measuring them is difficult due to data and methodological limitations. We estimate the negative spillovers caused by children from troubled families by exploiting a unique data set in which children’s school records are matched to domestic violence cases. We find that children from troubled families significantly decrease their peers’ reading and math test scores and increase misbehavior in the classroom. The achievement spillovers are robust to within-family differences and when controlling for school-by-year effects, providing strong evidence that neither selection nor common shocks are driving the results.
Down from the mountain: Skill upgrading and wages in Appalachia
Despite evidence that skilled labor is increasingly concentrated in cities, whether regional wage inequality is predominantly due to differences in skill levels or returns is unknown. We compare Appalachia, with its wide mix of urban and rural areas, to other parts of the U.S., and find that gaps in both skill levels and returns account for the lack of high wage male workers. For women, skill shortages are important across the distribution. Because rural wage gaps are insignificant, our results suggest that widening wage inequality between Appalachia and the rest of the U.S. owes to a shortage of skilled cities.
Bilingual education and English proficiency
English Learners, students who are not proficient in English and speak a non-English language at home, make up more than 10 percent of the nation’s K-12 student body. Achieving proficiency in English for these students is a major goal of both state and federal education policy, motivating the provision of bilingual education policies. Using data for nearly 500,000 English Learners from California, I show that students in bilingual education have substantially lower English proficiency than other English Learners in first and second grades. In contrast, there is little difference between bilingual education and other programs for students in grades three through five. These results hold across fixed effects, propensity score, and instrumental variables models.